Thursday, March 31, 2011

Radiation in Japan

Fukushima Nuclear Power Plant Explosion, March 14th


March 11, 2011

A earthquake of a magnitude of 9.0 on the Richter scale hit Japan near the coast of Honshu.  The earthquake then triggered massive tsunami waves reaching up to 23.6 m in height minutes after the quake had hit.  The waves reached nearly 10 kilometers inland.  Millions were left without electricity and water, which inadvertently led to three nuclear reactors exploding due to hydrogen build up when the cooling system failed.  On March 18, the head of the International Atomic Energy Agency, Yukiya Amano, declared the crisis extremely serious, which lead to anyone within 20 kilometers of the Fukushima I Nuclear Power Plant and 10 kilometers within the Fukushima II Nuclear Power Plant had to evacuate the area immediately.  But just how deadly is the nuclear material in the reactors.  What exactly is in the reactors that is causing this chaos?  Just how long does it take the radoactive material to travel, how far would it be able to travel, and how deadly would it still be?  Share your thoughts and opinions.

Tuesday, March 29, 2011

Da Vinci in the Renaissance

Image by MAMJODH on Flickr
     Leonardo Da Vinci, a well renown scientist, is known for his artwork, inventions, and craftiness. Everyone today would agree that he was a man ahead of his time. He developed things like the portable bridge, armored cars, and flying machines. He also worked with cannons and catapults and was a scientist wanted by every country for his wide knowledge and ability to think outside the box. Many of his inventions and concepts came about during the Renaissance--a turning point for man in history. Da Vinci even developed the early version and whole idea of the battle tank. It was designed to be run by many men and be mobile along the battlefield (a moving fortress). However within the designs there was a huge error where two gears opposed each other. This sort of error would have made the tank incapable moving or defending itself. Experts believe that Da Vinci being the mastermind that he was was too intelligent and observant to overlook such a major flaw in the design and the flaw was actually purposely placed there in order to protect it from being stolen and used by other countries and scientists we desperately wanted his insight and inventions. What are some other inventions and ideas of inventions of Da Vinci that are interesting? Is there a underlying fact that you find intriguing? How are some of his inventions influential in our world today? I  am looking forward to your responses

Thursday, March 10, 2011

Power: An Introduction to Google Spreadsheets


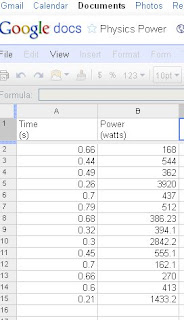
Students justed completed a very quick lab where they calculated how much power their lower body produces as they jump into the air. The results from each group were entered into a Google spreadsheet.

  1. It will be easiest to follow these instructions if you keep this page open all the time and use separate tabs for the activities.
  2. To create a Google spreadsheet, you will need a Google account (it's free). If you don't already have one, go to the Google sign-in page and follow the instructions.
  3. Make sure you've signed in to your Google account.
  4. Click on the screen shot of the spreadsheet, and the link will open the spreadsheet we generated in class. You will able to view the spreadsheet, but not edit it (I've set it up that way on purpose).
  5. Copy the data from our class spreadsheet to your computer's clipboard.
  6. Click the "Documents" link near the top of the spreadsheet.
  7. Find the drop-down list titled "Create new" near the left side of the screen. Click on it and select "Spreadsheet."
  8. Paste the copied data into this new spreadsheet. Since this is your spreadsheet, you are able to edit it and add to it.
  9. Congratulations, you have created your first Google spreadsheet!
Let's use the spreadsheet to analyze the data a little further. 
  1. In column C, insert a formula that will express each student's power in horsepower (remember, 1 hp = 746 watts). For example, you can do this for cell c2 with the formula "=b2/746".
  2. Have the spreadsheet calculate and display the average values for each column at the bottom of the data.
  3. I'd like to investigate the relationship between the measured time (column A) and the power (column B). Let's do this by creating a scatter plot of that data. To do this, highlight just that data, click on the "Insert chart" icon, and select the appropriate type of chart.
  4. When you're finished, click on the "Share" button in the upper-right portion of the screen to allow anyone online to see your completed work. (They will be able to view it, but not edit it.) Copy the automatically-generated link to your spreadsheet, and post it in the comment section to this post.